|
Step-by-step
analysis of graph
The
following photos are taken from a video clip of one cycle of a packing
job. Each photo shows one of the four primary steps of the task,
which involved picking up products from a pallet on the floor, then
placing them in three shipping boxes. The arrows show the
corresponding section of the graph (the graph was generated from a
full video clip; these photos are simply to help you see what the
graphs depict.)
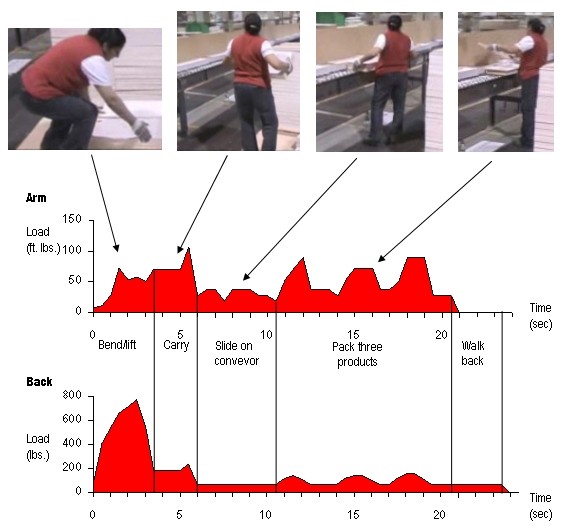
The f ull
work cycle for this task took 23.5 seconds, as shown on the horizontal
axes of the two graphs. The loads on the arms and back are shown on
the vertical axes, thus the higher the peak and the larger the area
under the curve, the greater the strain.
Bending and lifting the product from the pallet (3.5 seconds) is very
observable in the Back graph, as would be expected. The peak
loads are 707 lbs. for the back and
Carrying
the products to the conveyor (2.5 seconds) places a relatively small
load on the back since the employee is now erect. The load on the
arms increases somewhat because the products are large, causing the
arms to be more extended than when bending and lifting.
Sliding
the products along the conveyor is the next step (4.5 seconds).
Since the weight of the products now primarily rests on the conveyor,
the loads on the body are reduced.
Packing
the products in three boxes (10 seconds) results in three blips on the
graphs, as the arms are extended with the weight of the product in
order to put it into the box.
W alking
back to the pallet to
start another cycle is the final
step (3 seconds). No photo is shown of this step, but the absence of any load
other than the weight of the upper torso is clearly depicted on the
graph.
Time involved
— Packing the boxes (the
only value-added step) took 10 seconds. The remaining 13.5
seconds (57% of the work cycle) were wasted activities like walking
and carrying.
Comments
-
The graph
for the Back shows the issues most dramatically. Clearly the strain
on the back is associated with bending down to the pallet to lift the
product.
-
Most people
who are involved with ergonomics would understand this point without
needing to conduct a study. However, it can be helpful to show
managers and engineers this type of graph because it is easy to
understand and the problems sort of point themselves out.
|